DATASPLINTER

Lorson Ranch. See what the records say.

Understand your district’s taxes, spending, and debt. Explore the figures. Follow them to the source.

On this page: charts, comparisons, and sources
Which district is mine?

Find “Lorson Ranch Metropolitan District No.” on your property-tax notice. Choose that number above. A neighborhood name alone does not identify your district.

Viewing a district does not identify your home. District 1 is the starting example when no district is chosen. Confirm the district number on the property’s tax notice.

About the seven districts

Selected district: 2025 financial results

Choose your district above. Amounts below are from the 2025 annual record.

2025 annual update · 2024 historical detail · 2026 budgets and tax rates
2025 filings checked October 18, 2026; earlier source comparisons dated August 15, 2026. These are dated records, not live balances.

Earlier detail: 2024 actuals and 2026 budgets. The older cards and charts below retain their original dates and figures. Use the 2025 results above for the newer annual snapshot.

District being viewed

District 1

District tax rate · 2026
8.750 mills

A mill is $1 of tax for each $1,000 of assessed value; the taxable value on the property record, not the home’s sale price. This is only the district’s rate.

Source: 2026 levy form, PDF page 7
Reported spending · 2024
$1,185,564

Money the district reported spending during the year. This is not an individual homeowner's tax bill.

Source: 2024 spending, PDF page 10
Amount due after one year · 2024
$13,226,109

This is a reported long-term amount. It is not a yearly payment or a complete total of every debt.

Source: 2024 record, PDF page 21

MD1 2024 Audit and MD1 2026 Budget · Lorson Ranch Metropolitan District No. 1 · Retrieved August 15, 2026.

See District 1 figures and source links →

District being viewed

District 2

District tax rate · 2026
76.297 mills

A mill is $1 of tax for each $1,000 of assessed value; the taxable value on the property record, not the home’s sale price. This is only the district’s rate.

Source: 2026 levy form, PDF page 6
Reported spending · 2024
$1,169,258

Money the district reported spending during the year. This is not an individual homeowner's tax bill.

Source: 2024 spending, PDF page 10
Amount due after one year · 2024
$15,797,550

This is a reported long-term amount. It is not a yearly payment or a complete total of every debt.

Source: 2024 record, PDF page 20

MD2 2024 Audit and MD2 2026 Budget · Lorson Ranch Metropolitan District No. 2 · Retrieved August 15, 2026.

See District 2 figures and source links →

District being viewed

District 3

District tax rate · 2026
76.327 mills

A mill is $1 of tax for each $1,000 of assessed value; the taxable value on the property record, not the home’s sale price. This is only the district’s rate.

Source: 2026 levy form, PDF page 7
Reported spending · 2024
$2,087,786

Money the district reported spending during the year. This is not an individual homeowner's tax bill.

Source: 2024 spending, PDF page 10
Amount due after one year · 2024
$26,273,736

This is a reported long-term amount. It is not a yearly payment or a complete total of every debt.

Source: 2024 record, PDF page 19

MD3 2024 Audit and MD3 2026 Budget · Lorson Ranch Metropolitan District No. 3 · Retrieved August 15, 2026.

See District 3 figures and source links →

District being viewed

District 4

District tax rate · 2026
75.885 mills

A mill is $1 of tax for each $1,000 of assessed value; the taxable value on the property record, not the home’s sale price. This is only the district’s rate.

Source: 2026 levy form, PDF page 8
Reported spending · 2024
$3,666,725

Money the district reported spending during the year. This is not an individual homeowner's tax bill.

Source: 2024 spending, PDF page 10
Amount due after one year · 2024
$62,357,959

This is a reported long-term amount. It is not a yearly payment or a complete total of every debt.

Source: 2024 record, PDF page 19

MD4 2024 Audit and MD4 2026 Budget · Lorson Ranch Metropolitan District No. 4 · Retrieved August 15, 2026.

See District 4 figures and source links →

District being viewed

District 5

Two records give different tax rates.

The levy form lists 2.749 mills. The budget text lists 8.750 mills. We show the levy form rate below. Check your tax notice or ask the district which rate applies.

District tax rate · 2026
2.749 mills

A mill is $1 of tax for each $1,000 of assessed value; the taxable value on the property record, not the home’s sale price. This is only the district’s rate.

Source: 2026 levy form, PDF page 4
Reported spending · 2024
$847

Money the district reported spending during the year. This is not an individual homeowner's tax bill.

Source: 2024 spending, PDF page 2
Amount due after one year · 2024
$0

The record reports zero in this category. That does not mean the district has no debt or other bills.

Source: 2024 record, PDF page 3

MD5 2024 Audit Exemption and MD5 2026 Budget · Lorson Ranch Metropolitan District No. 5 · Retrieved August 15, 2026.

See District 5 figures and source links →

District being viewed

District 6

District tax rate · 2026
69.668 mills

A mill is $1 of tax for each $1,000 of assessed value; the taxable value on the property record, not the home’s sale price. This is only the district’s rate.

Source: 2026 levy form, PDF page 7
Reported spending · 2024
$256,318

Money the district reported spending during the year. This is not an individual homeowner's tax bill.

Source: 2024 spending, PDF page 10
Amount due after one year · 2024
$0

The record reports zero in this category. That does not mean the district has no debt or other bills.

Source: 2024 record, PDF page 7 and 17

MD6 2024 Audit and MD6 2026 Budget · Lorson Ranch Metropolitan District No. 6 · Retrieved August 15, 2026.

See District 6 figures and source links →

District being viewed

District 7

District tax rate · 2026
10.740 mills

A mill is $1 of tax for each $1,000 of assessed value; the taxable value on the property record, not the home’s sale price. This is only the district’s rate.

Source: 2026 levy form, PDF page 5
Reported spending · 2024
$7,690

Money the district reported spending during the year. This is not an individual homeowner's tax bill.

Source: 2024 spending, PDF page 2
Amount due after one year · 2024
$0

The record reports zero in this category. That does not mean the district has no debt or other bills.

Source: 2024 record, PDF page 3

MD7 2024 Audit Exemption and MD7 2026 Budget · Lorson Ranch Metropolitan District No. 7 · Retrieved August 15, 2026.

See District 7 figures and source links →

Explore the records

Worked example / MD 3 / 2025

MD 3 to MD 4 · 2025

Two source lines total $3,718,629.

Reported by MD 3 to MD 4

$3,718,629

Check the two source lines
MD 3 expenditure statement
Fund / line to MD 4Amount
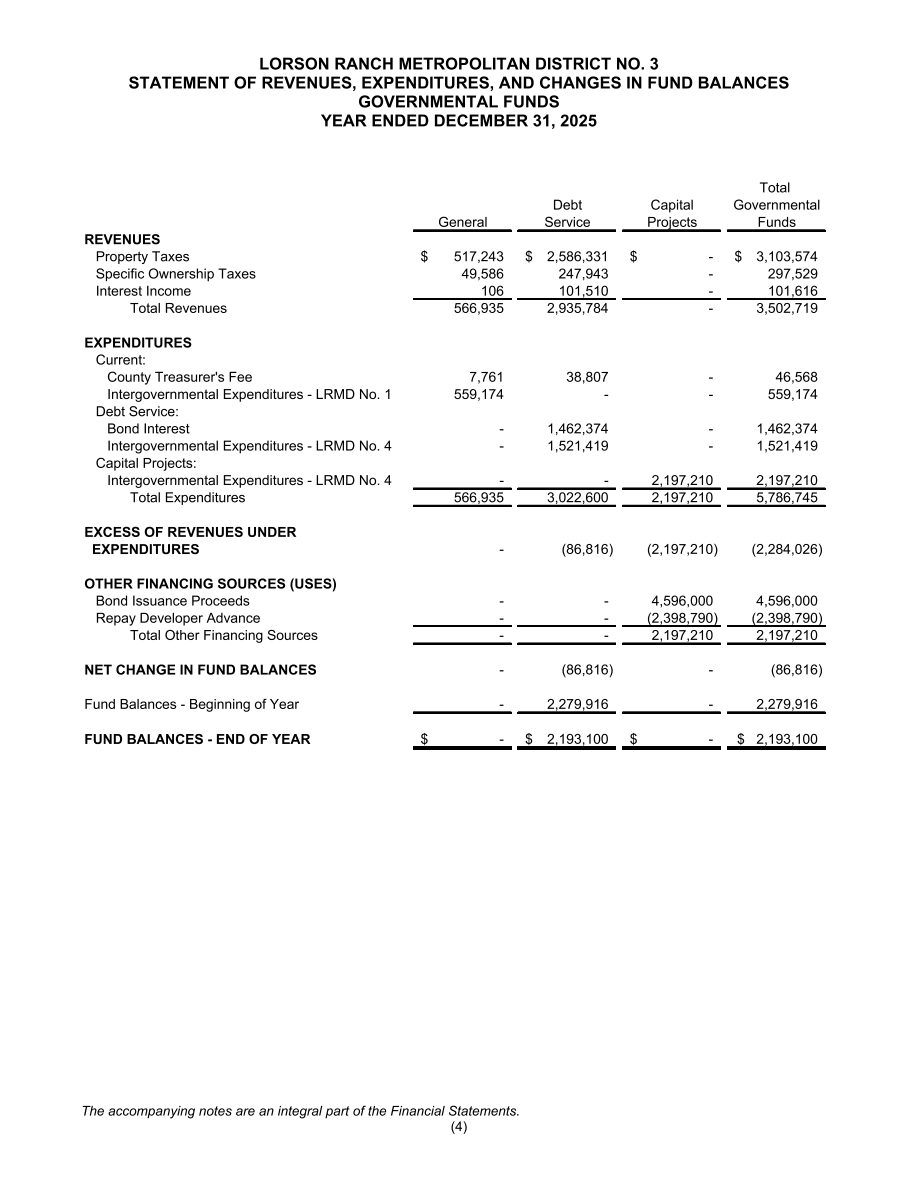
Debt service$1,521,419
Capital projects$2,197,210

$1,521,419 + $2,197,210
= $3,718,629

Open MD 3 audit · PDF page 10 (new tab)

The source page

MD 3 2025 expenditure statement. The two MD 4 lines are $1,521,419 and $2,197,210; the table beside this image transcribes them.
PDF page 10 · printed page 4. Open the image at full size (new tab).
Context and limits

If the source image does not load, use the audit link and listed PDF page.

Two reported expenditure lines add up to the amount shown. You can check both on the same source page.

This example stays on MD 3 when you choose another district.

2025 financial record · PDF page 10 / printed page 4
Existing source comparison: October 18, 2026

This is the sum of the debt-service and capital-projects entries to MD 4.

Keep the accounting context. Interdistrict entries remain in the district totals. This figure does not trace an individual homeowner’s tax payment.

Selected relationships / 2025

Between districts · 2025

Two examples, not a complete cash-flow map.

MD 3 expenditures and MD 4 revenue

MD 3Reported expenditures
$3,718,6292025 · Two expenditure lines
MD 4Matching reported revenue
Check the two source lines and calculation

Infrastructure received by MD 1

Not ordinary cash spending.

MD 6Dedication from MD 6
$47,210,1682025 · Infrastructure dedication
MD 1Infrastructure assets received
Context and limits

Follow one documented relationship at a time. These examples use different accounting measures and must not be added together.

These examples stay on the districts named below when you choose another district.

Read this as an accounting relationship. The same interdistrict amount appears in the two records. Adding district totals retains these internal entries; it does not show only money entering or leaving the seven districts.

MD 3 reports $1,521,419 plus $2,197,210 in expenditures to MD 4. MD 4 reports matching revenue of $3,718,629. Period: year ended December 31, 2025.

The diagram does not establish the dates of individual cash movements.

Not ordinary cash operating spending. MD 1 reports the amount as capital outlay and the same amount as capital dedication under other financing sources. Its notes identify infrastructure assets received.

MD 1’s 2025 record describes $47,210,168 of infrastructure dedication from MD 6. Period: year ended December 31, 2025. This is a separate accounting category from the reported interdistrict expenditure example.

Selected relationships only, not a complete map of all seven districts. Arrow widths do not represent dollar amounts. Budget plans and debt events are separate from these examples.
MD 6 / Year-end balance and later event

MD 6 · Two reporting dates

Do not add the refinancing to the earlier balance.

  1. Year-end amount due after one year

    $48,025,352

    MD 6 audit · PDF p. 7 (new tab)
  2. Later refinancing reported in the audit

    $45,993,000

    Reported bond issue and loan refunding. The audit also reports $3,635,665 remaining under the developer agreement.

Context and limits

This timeline concerns MD 6. The amounts describe different dates and measures.

A dated balance, not an annual payment or a current payoff quote.

A closing or payoff schedule is needed to connect the 2026 refinancing to the 2025 year-end balance.

Do not add the refinancing to the earlier balance. The amounts describe different dates. The available comparison does not establish savings, added costs, or a change to a homeowner’s tax bill.

Annual records / Year ended December 31, 2025

2025 results, with the source context

All seven 2025 filings are available in Colorado's state auditor portal: five audits and two audit exemptions. They are annual records, not today's balances. The 2024 detail remains available for comparison.

Reported revenue

$17,456,855

Sum across seven records. Includes receipts from other Lorson Ranch districts.

Reported expenditures

$64,114,420

Includes a $47,210,168 infrastructure dedication reported by MD 1. This is not a cash operating-spending total.

Due after one year

$164,546,965

Year-end amounts across the records. Excludes MD 2's $244,758 current portion and future interest not yet accrued.

2025 sources and formulas

Revenue = $3,472,907 + $2,252,861 + $3,502,719 + $6,786,907 + $354 + $1,434,751 + $6,356. Expenditures = $50,465,817 + $2,958,410 + $5,786,745 + $4,610,948 + $354 + $285,790 + $6,356. Due after one year = $12,424,821 + $15,552,792 + $28,471,000 + $60,073,000 + $0 + $48,025,352 + $0.

The audit figures use governmental-fund revenue and expenditures. The exemption forms use their prescribed reporting basis. Other financing sources and uses are excluded from these revenue/expenditure totals. These are gross sums, not consolidated accounts, a repayment ratio or homeowner bills.

Download all seven 2025 rows and source pages (CSV)

Due after one year: 2024 and 2025

Both bars use the same $65 million scale. The amounts combine principal and other balances reported as noncurrent. They are not annual payments.

Later event: MD 6 refunding

MD 6's 2025 audit reports a May 20, 2026 bond issue and loan refunding of $45,993,000, with $3,635,665 remaining under the developer agreement. These are later-event disclosures. Do not add the refunding amount to the 2025 note balance as though both remain outstanding unchanged.

MD 6 note and subsequent refinancing (PDF p. 19) · MD 6 continuation (PDF p. 20)

MD 3's 2025 audit confirms the $4,596,000 bond draw on October 22, 2025. MD 4's confirms the $8,301,675 senior draw. MD 4's subordinate principal at December 31, 2025 was $15,430,000; the 2025 audit still lists December 15, 2057 as maturity.

MD 3 roll-forward (PDF p. 19) · MD 4 roll-forward (PDF p. 19) · MD 4 bond terms (PDF p. 20)

02 / Reported spending

What did the money pay for?

See the spending reported for 2024. Interest is the cost of borrowing. Principal is the borrowed amount being paid back.

District 1 · 2024 reported spending

$1,185,564

Total reported for the year

Bars show shares of the total named above: 0% to 100%. The dollar scale changes when you choose another district.

  1. Bond interest $0
  2. Transfers to other districts $0
  3. Landscaping $559,898
  4. Administration and fees $154,718
  5. Landscape water $231,073
  6. Bond principal repaid $0
  7. Streetlights and entrances $161,933
  8. Other upkeep $77,942
Read the data as a table
District 1 ; 2024 reported spending
Item Dollars
Bond interest $0
Transfers to other districts $0
Landscaping $559,898
Administration and fees $154,718
Landscape water $231,073
Bond principal repaid $0
Streetlights and entrances $161,933
Other upkeep $77,942

District 2 · 2024 reported spending

$1,169,258

Total reported for the year

Bars show shares of the total named above: 0% to 100%. The dollar scale changes when you choose another district.

  1. Bond interest $628,844
  2. Transfers to other districts $345,681
  3. Landscaping $0
  4. Administration and fees $29,733
  5. Landscape water $0
  6. Bond principal repaid $165,000
  7. Streetlights and entrances $0
  8. Other upkeep $0
Read the data as a table
District 2 ; 2024 reported spending
Item Dollars
Bond interest $628,844
Transfers to other districts $345,681
Landscaping $0
Administration and fees $29,733
Landscape water $0
Bond principal repaid $165,000
Streetlights and entrances $0
Other upkeep $0

District 3 · 2024 reported spending

$2,087,786

Total reported for the year

Bars show shares of the total named above: 0% to 100%. The dollar scale changes when you choose another district.

  1. Bond interest $1,432,500
  2. Transfers to other districts $606,834
  3. Landscaping $0
  4. Administration and fees $48,452
  5. Landscape water $0
  6. Bond principal repaid $0
  7. Streetlights and entrances $0
  8. Other upkeep $0
Read the data as a table
District 3 ; 2024 reported spending
Item Dollars
Bond interest $1,432,500
Transfers to other districts $606,834
Landscaping $0
Administration and fees $48,452
Landscape water $0
Bond principal repaid $0
Streetlights and entrances $0
Other upkeep $0

District 4 · 2024 reported spending

$3,666,725

Total reported for the year

Bars show shares of the total named above: 0% to 100%. The dollar scale changes when you choose another district.

  1. Bond interest $3,124,708
  2. Transfers to other districts $498,417
  3. Landscaping $0
  4. Administration and fees $43,600
  5. Landscape water $0
  6. Bond principal repaid $0
  7. Streetlights and entrances $0
  8. Other upkeep $0
Read the data as a table
District 4 ; 2024 reported spending
Item Dollars
Bond interest $3,124,708
Transfers to other districts $498,417
Landscaping $0
Administration and fees $43,600
Landscape water $0
Bond principal repaid $0
Streetlights and entrances $0
Other upkeep $0

District 5 · 2024 reported spending

$847

Total reported for the year

Bars show shares of the total named above: 0% to 100%. The dollar scale changes when you choose another district.

  1. Bond interest $0
  2. Transfers to other districts $835
  3. Landscaping $0
  4. Administration and fees $12
  5. Landscape water $0
  6. Bond principal repaid $0
  7. Streetlights and entrances $0
  8. Other upkeep $0
Read the data as a table
District 5 ; 2024 reported spending
Item Dollars
Bond interest $0
Transfers to other districts $835
Landscaping $0
Administration and fees $12
Landscape water $0
Bond principal repaid $0
Streetlights and entrances $0
Other upkeep $0

District 6 · 2024 reported spending

$256,318

Total reported for the year

Bars show shares of the total named above: 0% to 100%. The dollar scale changes when you choose another district.

  1. Bond interest $0
  2. Transfers to other districts $236,575
  3. Landscaping $0
  4. Administration and fees $19,743
  5. Landscape water $0
  6. Bond principal repaid $0
  7. Streetlights and entrances $0
  8. Other upkeep $0
Read the data as a table
District 6 ; 2024 reported spending
Item Dollars
Bond interest $0
Transfers to other districts $236,575
Landscaping $0
Administration and fees $19,743
Landscape water $0
Bond principal repaid $0
Streetlights and entrances $0
Other upkeep $0

District 7 · 2024 reported spending

$7,690

Total reported for the year

Bars show shares of the total named above: 0% to 100%. The dollar scale changes when you choose another district.

  1. Bond interest $0
  2. Transfers to other districts $7,584
  3. Landscaping $0
  4. Administration and fees $106
  5. Landscape water $0
  6. Bond principal repaid $0
  7. Streetlights and entrances $0
  8. Other upkeep $0
Read the data as a table
District 7 ; 2024 reported spending
Item Dollars
Bond interest $0
Transfers to other districts $7,584
Landscaping $0
Administration and fees $106
Landscape water $0
Bond principal repaid $0
Streetlights and entrances $0
Other upkeep $0

Transfers move money between districts and are included here. The combined total is not a total of payments to outside recipients. These figures do not trace a particular household’s tax payment or measure service quality.

03 / Compare like with like

A balance is different from a payment.

The longer-term amounts below may include bonds, developer advances, and interest already owed. The spending chart above shows spending reported during one year. These are different measures.

2024 financial records

Amounts due after one year

Same dollar scale for all seven districts: $0 to $70 million.

  1. District 1 $13,226,109
  2. District 2 $15,797,550
  3. District 3 $26,273,736
  4. District 4 $62,357,959
  5. District 5 $0
  6. District 6 $0
  7. District 7 $0

A zero means this category was reported as zero. It does not establish that a district has no other bills or obligations.

Read the data as a table
Amounts reported as due after one year ; December 31, 2024
Item Dollars
District 1 $13,226,109
District 2 $15,797,550
District 3 $26,273,736
District 4 $62,357,959
District 5 $0
District 6 $0
District 7 $0

2026 levy forms

District tax rates

One mill is $1 of tax per $1,000 of assessed value. Assessed value is the taxable value, not the sale price. Scale: 0 to 80 mills.

  1. District 1 8.750 mills
  2. District 2 76.297 mills
  3. District 3 76.327 mills
  4. District 4 75.885 mills
  5. District 5 * 2.749 mills
  6. District 6 69.668 mills
  7. District 7 10.740 mills

* District 5: the records differ. The levy form lists 2.749 mills; the budget text lists 8.750 mills. This chart uses the levy form. Check the applicable rate with the district.

Read the data as a table
2026 district levy rates; MD 5 uses levy-form rate
Item Mills
District 1 8.750
District 2 76.297
District 3 76.327
District 4 75.885
District 5 * 2.749
District 6 69.668
District 7 10.740

04 / Keep the years in view

What happened. What was planned.

This page brings together two kinds of records. They answer different questions.

  1. 2024 and 2025

    Reported results

    Financial records describe money received, spending, and amounts owed for a completed year.

    Read the financial records ↗
  2. 2026

    Adopted plans

    Budgets describe planned income and spending. Levy forms state district tax rates.

    Read the budget figures ↗

This is a guide to the record years, not a trend chart. A budget should not be treated as a final spending result. 2025 filings were checked October 18, 2026. Earlier source copies were compared August 15, 2026.

Where can I ask about services?

Start with a specific question and your district number. Use the official district website to find contacts, board meeting notices, and records.

The finance records alone do not show who is responsible for every road, service, or neighborhood rule.

Check a fact before you share it.

Keep the district number, record year, and source link with a figure. The 2026 budgets are plans. The 2024 and 2025 financial records describe completed years.

For a home sale, check the property's tax notice. A district summary is not a quote for the taxes a buyer will pay.

PDF source links open in a new tab. Page numbers count from the first page of the PDF; they may differ from printed page numbers. If your viewer does not jump to the page, enter the listed number.

For reporting or research, use the detailed view to inspect source pages, formulas, and download tables. Differences between source records stay visible in both views.

Each figure links to the public record and the page it came from. Totals are the sums of those cited lines. An automated reviewer compared the 2025 figures to those pages on October 18, 2026. A person did not repeat that comparison. The linked record controls if they differ.

DataSplinter is independent of the districts. Original records remain the authority. This is a reading aid, not an audit, a tax quote, or professional advice.

Sources and sharing