DataSplinter™ / Metro Districts / Project 01

Lorson Ranch detailed records

Metropolitan District Nos. 1-7

Check the figures, compare districts, and open the source pages. These records use different years and accounting categories. Read the dates and limits before comparing them.

Choose your district

Viewing a district does not identify your home. District 1 is the starting example when no district is chosen. Confirm the district number on the property’s tax notice.

The first card shows 2025 annual results. The older summary retains 2024 actuals; its tax rate and planned spending are from 2026.

This choice changes the district summary only. Comparisons below still cover all seven districts or the district named in the heading.

Selected district: 2025 financial results

Choose your district above. Amounts below are from the 2025 annual record.

2025 annual update · 2024 historical detail · 2026 budgets and levies · 2025 filings checked October 18, 2026 Dates and limits ↗

Earlier detail: 2024 actuals and 2026 budgets. The older cards and charts below retain their original dates and figures. Use the 2025 results above for the newer annual snapshot.

District being viewed

MD 1

2024 record includes operations and maintenance spending

2026 district tax rate
8.750 mills
Due after one year · 2024
$13,226,109
Money in during 2024
$1,722,961
Spent during 2024
$1,185,564
Planned spending for 2026
$33,522,000

This is the amount the record reports as due after one year, not a statement of total debt.

2024 financial record · 2026 budget and levy record

Not sure which district is yours?Look for “Lorson Ranch Metropolitan District No. X” on your property-tax notice.How to use the record

District comparisons

Compare the seven districts

Districts have different roles and sizes. These totals do not rank value, efficiency or household costs. Transfers remain in the records; do not add district totals together.

2026 certified levies

District tax rates

A mill levy is a tax rate applied to assessed property value. One mill equals $1 per $1,000 of assessed value.

MD 5 records show different rates: its levy certification says 2.749 mills, while text in its budget says 8.750 mills. The comparison below uses the certified rate. Confirm the applicable rate on the property-tax notice or with the district.

Certified rates for all seven districts

2026 listed rates in mills
DistrictMillsPeriodSource

Long-term balances

Audited amounts exclude sums due within one year and include interest or premiums where reported. Districts 5 and 7 report no debt on exemption forms, not an absence of all liabilities. District 6’s later refinancing is separate.

December 31, 2025 · Dollars
DistrictAmountOriginal record
District 1$12,424,821Source PDF
District 2$15,552,792Source PDF
District 3$28,471,000Source PDF
District 4$60,073,000Source PDF
District 5$0Source PDF
District 6$48,025,352Source PDF
District 7$0Source PDF

Reported spending

District 1 includes $47,210,168 of infrastructure dedication, not ordinary operating spending. Its services, administration and debt costs total $3,255,649. District 6’s matching infrastructure and note entries are outside its spending total. Borrowing and developer repayments reported as financing entries remain separate.

2025 actual expenditures · Dollars
DistrictAmountOriginal record
District 1$50,465,817Source PDF
District 2$2,958,410Source PDF
District 3$5,786,745Source PDF
District 4$4,610,948Source PDF
District 5$354Source PDF
District 6$285,790Source PDF
District 7$6,356Source PDF

Download comparison figures, sources and district-specific caveats (CSV)

Earlier overview and source trail

Return to the homeowner guide

Explore the records

Worked example / MD 3 / 2025

MD 3 to MD 4 · 2025

MD 3 expenditures and MD 4 revenue

MD 3Reported expenditures
$3,718,6292025 · Two expenditure lines
MD 4Matching reported revenue

The same amount appears in both district records and remains in their gross totals. These entries do not establish individual cash-movement dates.

How the reported amount adds up

Check the two source lines
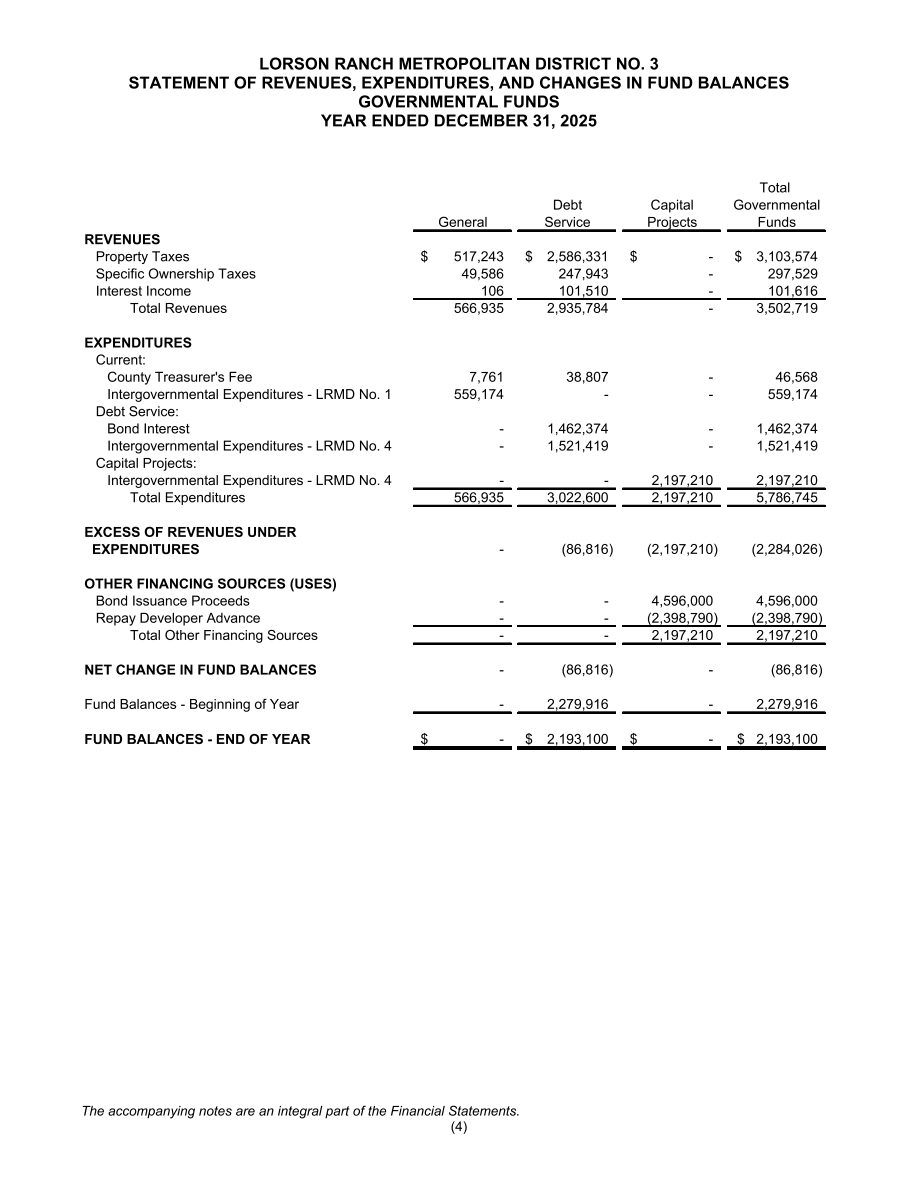
MD 3 expenditure statement
Fund / line to MD 4Amount
Debt service$1,521,419
Capital projects$2,197,210

$1,521,419 + $2,197,210
= $3,718,629

Open MD 3 audit · PDF page 10 (new tab)

The source page

MD 3 2025 expenditure statement. The two MD 4 lines are $1,521,419 and $2,197,210; the table beside this image transcribes them.
PDF page 10 · printed page 4. Open the image at full size (new tab).
Context and limits

If the source image does not load, use the audit link and listed PDF page.

Governmental funds · Intergovernmental expenditures to LRMD No. 4 · Year ended December 31, 2025.

This example stays on MD 3 when you choose another district.

2025 financial record · PDF page 10 / printed page 4
Existing source comparison: October 18, 2026

This is the sum of the debt-service and capital-projects entries to MD 4.

Keep the accounting context. Interdistrict entries remain in the district totals. This figure does not trace an individual homeowner’s tax payment.

The source labels both entries “Intergovernmental Expenditures - LRMD No. 4.” These are reported expenditure categories, not transaction-level proof of a particular cash payment.

Selected relationships / 2025

Infrastructure between districts · 2025

A separate accounting relationship. See the combined MD 3 to MD 4 example.

Infrastructure received by MD 1

Not ordinary cash spending.

MD 6Dedication from MD 6
$47,210,1682025 · Infrastructure dedication
MD 1Infrastructure assets received
Context and limits

Follow one documented relationship at a time. These examples use different accounting measures and must not be added together.

These examples stay on the districts named below when you choose another district.

Read this as an accounting relationship. The same interdistrict amount appears in the two records. Adding district totals retains these internal entries; it does not show only money entering or leaving the seven districts.

The diagram does not establish the dates of individual cash movements.

Not ordinary cash operating spending. MD 1 reports the amount as capital outlay and the same amount as capital dedication under other financing sources. Its notes identify infrastructure assets received.

MD 1’s 2025 record describes $47,210,168 of infrastructure dedication from MD 6. Period: year ended December 31, 2025. This is a separate accounting category from the reported interdistrict expenditure example.

Selected relationships only, not a complete map of all seven districts. Arrow widths do not represent dollar amounts. Budget plans and debt events are separate from these examples.

MD 6 / Year-end balance and later event

MD 6 · Two reporting dates

Do not add the refinancing to the earlier balance.

  1. Year-end amount due after one year

    $48,025,352

    MD 6 audit · PDF p. 7 (new tab)
  2. Later refinancing reported in the audit

    $45,993,000

    Reported bond issue and loan refunding. The audit also reports $3,635,665 remaining under the developer agreement.

Context and limits

This timeline concerns MD 6. The amounts describe different dates and measures.

A dated balance, not an annual payment or a current payoff quote.

Comparison scope: year-end statement and subsequent-events notes; not an executed closing reconciliation.

A closing or payoff schedule is needed to connect the 2026 refinancing to the 2025 year-end balance.

Do not add the refinancing to the earlier balance. The amounts describe different dates. The available comparison does not establish savings, added costs, or a change to a homeowner’s tax bill.

Annual records / Year ended December 31, 2025

2025 results, with the source context

All seven 2025 filings are available in Colorado's state auditor portal: five audits and two audit exemptions. They are annual records, not today's balances. The 2024 detail remains available for comparison.

Reported revenue

$17,456,855

Sum across seven records. Includes receipts from other Lorson Ranch districts.

Reported expenditures

$64,114,420

Includes a $47,210,168 infrastructure dedication reported by MD 1. This is not a cash operating-spending total.

Due after one year

$164,546,965

Year-end amounts across the records. Excludes MD 2's $244,758 current portion and future interest not yet accrued.

2025 sources and formulas

Revenue = $3,472,907 + $2,252,861 + $3,502,719 + $6,786,907 + $354 + $1,434,751 + $6,356. Expenditures = $50,465,817 + $2,958,410 + $5,786,745 + $4,610,948 + $354 + $285,790 + $6,356. Due after one year = $12,424,821 + $15,552,792 + $28,471,000 + $60,073,000 + $0 + $48,025,352 + $0.

The audit figures use governmental-fund revenue and expenditures. The exemption forms use their prescribed reporting basis. Other financing sources and uses are excluded from these revenue/expenditure totals. These are gross sums, not consolidated accounts, a repayment ratio or homeowner bills.

Download all seven 2025 rows and source pages (CSV)

Due after one year: 2024 and 2025

Both bars use the same $65 million scale. The amounts combine principal and other balances reported as noncurrent. They are not annual payments.

Later event: MD 6 refunding

MD 6's 2025 audit reports a May 20, 2026 bond issue and loan refunding of $45,993,000, with $3,635,665 remaining under the developer agreement. These are later-event disclosures. Do not add the refunding amount to the 2025 note balance as though both remain outstanding unchanged.

MD 6 note and subsequent refinancing (PDF p. 19) · MD 6 continuation (PDF p. 20)

MD 3's 2025 audit confirms the $4,596,000 bond draw on October 22, 2025. MD 4's confirms the $8,301,675 senior draw. MD 4's subordinate principal at December 31, 2025 was $15,430,000; the 2025 audit still lists December 15, 2057 as maturity.

MD 3 roll-forward (PDF p. 19) · MD 4 roll-forward (PDF p. 19) · MD 4 bond terms (PDF p. 20)

Seven districts · 2024 records

Across all seven districts

These totals answer separate questions: what was reported as due beyond one year, and how much revenue was reported during 2024. They do not form a repayment ratio.

Link to this figure

Across seven 2024 records

$117.7M

Reported as due after one year

Checked against 2024 financial records · MD 1-7

How calculated
Source documents and entities
2024 audited financial statements for MD 1, 2, 3, 4, and 6; 2024 audit-exemption records for MD 5 and 7.
Fiscal period
Year ended December 31, 2024.
Source URLs
Exact pages
MD 1 PDF p. 21; MD 2 p. 20; MD 3 p. 19; MD 4 p. 19; MD 5 p. 3; MD 6 pp. 7 and 17; MD 7 p. 3.
Included / excluded
Includes the amount each record reports as due after one year. MD 2’s $215,210 due within one year is excluded. Including it would produce $117,870,564 in total long-term obligations.
Formula
$13,226,109 + $15,797,550 + $26,273,736 + $62,357,959 + $0 + $0 + $0 = $117,655,354, displayed as $117.7M.
Retrieval date
August 15, 2026.
Calculation version
provenance-2026.10.18.2
Link to this figure

2024 actual

$12.1M

Revenue reported during 2024

Exact reported total · $12,122,039

How calculated
Source documents and entities
2024 financial records for Lorson Ranch MD 1-7.
Fiscal period
Year ended December 31, 2024.
Source URLs
Exact pages
Audited statements: PDF p. 10 for MD 1, 2, 3, 4, and 6. Audit exemptions: PDF p. 2 for MD 5 and 7.
Included / excluded
Includes every revenue line in the seven linked 2024 records. No district record is excluded.
Formula
$1,722,961 + $2,318,294 + $3,480,948 + $3,152,106 + $847 + $1,439,193 + $7,690 = $12,122,039.
Retrieval date
August 15, 2026.
Calculation version
provenance-2026.10.18.2

These figures cover different periods and accounting categories. They provide context, but they are not a direct measure of financial performance or homeowner tax bills.

Link to this figure

District family

7

Separate metropolitan districts

How calculated
Source document and entity
2026 transparency notices for Lorson Ranch Metropolitan District Nos. 1-7.
Reporting period
Each notice is dated January 8, 2026.
Exact pages
MD 1-4 and 6 notice dates: PDF p. 6; MD 5 and 7: PDF p. 2.
Included / excluded
Includes District Nos. 1-7 only. No broader-neighborhood districts are included.
Formula
Direct count of the seven district notices represented in this project.
Retrieval date
August 15, 2026.
Calculation version
provenance-2026.10.18.2
Link to this figure

Official 2026 rate

76.3 mills

Highest official district tax rate

How calculated
Source documents and entities
2026 final budgets and attached tax-levy certifications for MD 1-7.
Fiscal period
2026 budget year; certifications dated December 15, 2025.
Source URLs
Exact pages
MD 1 p. 7; MD 2 p. 6; MD 3 p. 7; MD 4 p. 8; MD 5 p. 4; MD 6 p. 7; MD 7 p. 5.
Included / excluded
Uses certified total levies: 8.750, 76.297, 76.327, 75.885, 2.749, 69.668, and 10.740 mills. MD 5’s narrative separately states 8.750 mills; the certification controls this comparison and the inconsistency is disclosed.
Formula
Maximum of the seven certified rates is MD 3 at 76.327 mills, displayed as 76.3.
Retrieval date
August 15, 2026.
Calculation version
provenance-2026.10.18.2

2024 revenue

Revenue by category

The seven districts reported $12.12 million in revenue during 2024. This total includes money received from other Lorson Ranch districts, not just money from outside the seven districts.

2024 reported revenue

82.2%

came from property and specific ownership taxes

$9,966,722 of $12,122,039. The records use “specific ownership tax” for vehicle-ownership tax revenue. The rest came from other districts, interest, and other reported sources.

View revenue calculation and source details
Source / period
2024 financial records for MD 1-7; year ended December 31, 2024.
Source URLs
Pages / retrieval date
Audited statements PDF p. 10; MD 5 and 7 exemption records p. 2. Retrieved August 15, 2026.
Included / excluded
Includes every property-tax and specific-ownership-tax line in the seven records.
Formula
$9,966,722 ÷ $12,122,039 = 82.220%, displayed as 82.2%.
Calculation version
provenance-2026.10.18.2
2024 reported revenue; denominator $12,122,039
CategoryAmountShare

2024 spending

Spending by category

The seven districts reported $8.37 million in spending during 2024. Bond interest was the largest category. This total includes transfers between districts, not just payments to outside recipients.

Link to this figure

For every $1 of 2024 reported spending

Reported spending per dollar

61.9¢bond interest
2.0¢bond principal
36.1¢everything else

Looking only at the $5,351,052 reported as bond interest or principal: 96.9¢ of each dollar went to interest and 3.1¢ went to principal.

The principal amount is the bond-principal spending reported in the seven 2024 records; it is not the change in every outstanding balance.

How calculated
Source documents and entities
2024 financial records for Lorson Ranch MD 1-7.
Fiscal period
Year ended December 31, 2024.
Source URLs
Exact pages
Audited governmental-fund statements: PDF p. 10 for MD 1, 2, 3, 4, and 6. Audit exemptions: PDF p. 2 for MD 5 and 7.
Included items
Bond-interest expenditures: MD 2 $628,844; MD 3 $1,432,500; MD 4 senior $1,812,708; MD 4 subordinate $1,312,000. Reported bond principal: MD 2 $165,000. The spending-dollar denominator includes all expenditures reported across the seven records.
Excluded items
Noncash accrued-interest changes are excluded from the interest numerator.
Spending-dollar formulas
Interest: $5,186,052 ÷ $8,374,188 = 61.929%, displayed as 61.9¢ per dollar. Principal: $165,000 ÷ $8,374,188 = 1.970%, displayed as 2.0¢ per dollar.
Bond-payment-only formula
Interest and principal total $5,351,052. Interest is 96.916% and principal is 3.084% of that amount, displayed as 96.9¢ and 3.1¢ per dollar.
Retrieval date
August 15, 2026.
Calculation version
provenance-2026.10.18.2

All reported spending

The chart and table show every spending category. You can also open all 35 reported line items.

Water and landscape: $790,971

MD 1 reported $515,233 for landscape maintenance, $44,665 for landscape improvements, and $231,073 for landscape water. Streetlights and entrance electricity are separate at $161,933.

How calculated
Source / period
MD 1 2024 audited financial statements; year ended December 31, 2024.
Source URL
MD 1 2024 Audit
Page / reported lines
PDF p. 10: Landscape Maintenance, Landscape Improvements, and Landscape Water.
Included / excluded
The water and landscape total includes those three lines. Streetlights And Entrance Electric is a separate $161,933 line and is not included.
Formula
$515,233 + $44,665 + $231,073 = $790,971.
Retrieval date
August 15, 2026.
Calculation version
provenance-2026.10.18.2
2024 reported expenditures; denominator $8,374,188
CategoryAmountShare
See all 35 reported expense lines

These records show accounting lines, not every check or invoice. MD 5 and MD 7 filed audit-exemption forms, so their reporting basis differs from the audited district statements.

Every nonzero expense line reported in the reviewed 2024 financial records
District and reported lineAmountSource
MD 1Accounting$51,478MD1 2024 AuditPDF p. 10
MD 1Auditing$26,200MD1 2024 AuditPDF p. 10
MD 1County Treasurer's Fee$4MD1 2024 AuditPDF p. 10
MD 1District Management$37,301MD1 2024 AuditPDF p. 10
MD 1Dues And Membership$5,439MD1 2024 AuditPDF p. 10
MD 1Insurance$21,297MD1 2024 AuditPDF p. 10
MD 1Legal$12,999MD1 2024 AuditPDF p. 10
MD 1Holiday Lighting$25,000MD1 2024 AuditPDF p. 10
MD 1Landscape Maintenance$515,233MD1 2024 AuditPDF p. 10
MD 1Landscape Improvements$44,665MD1 2024 AuditPDF p. 10
MD 1Landscape Water$231,073MD1 2024 AuditPDF p. 10
MD 1Repair And Maintenance$39,292MD1 2024 AuditPDF p. 10
MD 1Streetlights And Entrance Electric$161,933MD1 2024 AuditPDF p. 10
MD 1Mosquito Mitigation$13,650MD1 2024 AuditPDF p. 10
MD 2County Treasurer's Fee$28,858MD2 2024 AuditPDF p. 10
MD 2Intergovernmental Expenditures - LRMD No. 1$345,681MD2 2024 AuditPDF p. 10
MD 2Bond Interest$628,844MD2 2024 AuditPDF p. 10
MD 2Bond Principal$165,000MD2 2024 AuditPDF p. 10
MD 2Paying Agent Fees$875MD2 2024 AuditPDF p. 10
MD 3County Treasurer's Fee$46,452MD3 2024 AuditPDF p. 10
MD 3Intergovernmental Expenditures - LRMD No. 1$556,536MD3 2024 AuditPDF p. 10
MD 3Bond Interest$1,432,500MD3 2024 AuditPDF p. 10
MD 3Paying Agent Fees$2,000MD3 2024 AuditPDF p. 10
MD 3Intergovernmental Expenditures - LRMD No. 4$50,298MD3 2024 AuditPDF p. 10
MD 4County Treasurer's Fee$41,600MD4 2024 AuditPDF p. 10
MD 4Intergovernmental Expenditures - LRMD No. 1$498,417MD4 2024 AuditPDF p. 10
MD 4Bond Interest$1,812,708MD4 2024 AuditPDF p. 10
MD 4Bond Interest - Subordinate$1,312,000MD4 2024 AuditPDF p. 10
MD 4Paying Agent Fees$2,000MD4 2024 AuditPDF p. 10
MD 5Administrative$12MD5 2024 Audit ExemptionPDF p. 2
MD 5Other (specify): Transfers to Other Districts$835MD5 2024 Audit ExemptionPDF p. 2
MD 6County Treasurer's Fee$19,743MD6 2024 AuditPDF p. 10
MD 6Intergovernmental Expenditures - LRMD No. 1$236,575MD6 2024 AuditPDF p. 10
MD 7Administrative$106MD7 2024 Audit ExemptionPDF p. 2
MD 7Other (specify): Transfers to Other Districts$7,584MD7 2024 Audit ExemptionPDF p. 2

2024 long-term amounts

Reported long-term obligations

The $117.7 million combines bonds, developer advances, accrued interest, and adjusted balances reported across the districts.

Reading these tables: the seven district amounts below add to $117,655,354. The later table of eight grouped obligation rows uses mixed types of balances; those rows should not be added together as total debt.

Long-term amounts by district

Amounts reported as due after one year
DistrictDue after one yearPeriodSource record
Optional: MD 4 bond terms and hypothetical debt growth

This uses the 2024 record and assumes no later payments. It is not a current balance or a forecast. Check the unresolved maturity-date question.

Link to this figure

A closer look at MD 4

Year-end principal reported for Series 2022B

$16.4M

MD 4 subordinate bond principal

8%interest rate each year
2057year it is due to mature
$1.312Minterest spent on this bond in 2024

“Subordinate” means this bond is paid after higher-priority obligations under its terms. The reported principal remained $16.4 million at year end.

Checked against MD 4’s 2024 audited financial statements

How calculated
Source document and entity
Lorson Ranch Metropolitan District No. 4, 2024 audited financial statements.
Fiscal period
Year ended December 31, 2024.
Exact pages
Principal: PDF pp. 9 and 19. 2024 subordinate interest expenditure: p. 10. Rate, annual cadence, maturity, and compounding terms: p. 20.
Included / excluded
Directly displays the Series 2022B year-end principal. Accrued interest and other MD 4 obligations are excluded.
Formula
No aggregation; $16,400,000 is displayed as $16.4M.
Retrieval date
August 15, 2026.
Calculation version
provenance-2026.10.18.2
Explore an illustration: what if no payments are made?
Link to this figure

If no payments are made after 2024

How $16.4 million would compound through 2057

$207.9M

The calculation adds 8% once a year for 33 years. Actual future balances depend on payments and available revenue.

Important: This is an illustration, not a prediction of payments, taxes, or homeowner bills.

How calculated
Source input
MD 4 Series 2022B principal, 8% annual rate, annual December 15 compounding, and December 15, 2057 maturity.
Exact pages
PDF pp. 19-20.
Included / excluded
Includes the December 31, 2024 principal and 33 annual compounding dates from December 15, 2025 through December 15, 2057. Excludes every payment after 2024.
Formula
$16,400,000 × 1.0833 = $207,887,214, displayed as $207.9M.
What it does not show
It does not predict future pledged revenue, future payments, taxes, or homeowner bills.
Retrieval date
August 15, 2026.
Calculation version
provenance-2026.10.18.2

Eight grouped obligation rows from the 2024 records

How reconciled
Source / entities / period
2024 financial records for MD 1-7; year ended December 31, 2024.
Source URLs
Pages / retrieval date
MD 1 p. 21; MD 2 p. 20; MD 3 p. 19; MD 4 p. 19; retrieved August 15, 2026.
Included / excluded
The table mixes principal-only and combined balances. MD 1 and MD 4 each group capital and regional developer advances; eight rows do not mean eight separate agreements. MD 4’s advance amount already includes $2,250,375 in accrued interest. The bridge is MD 1 accrued bond interest $3,349,818; MD 1 accrued developer interest $14,944; MD 2 bond premium $662,760 less current principal $175,000 and current premium $40,210, a net adjustment of $447,550; and MD 3 accrued developer interest $2,397,742.
Formula
$111,445,300 + $6,210,054 = $117,655,354.
Calculation version
provenance-2026.10.18.2
Compare eight grouped obligation rows (2024)

Wide table: scroll sideways to see every column. Open the source records for the original layout.

December 31, 2024: eight grouped rows; mixed measures; see the adjustments below
DistrictRecord labelReported amountAmount basisRateMaturityTypeSource

MD 4 debt-authorization record

The MD 4 audit describes authorization dates, amounts, and bond terms. Authorization is permission to borrow up to a limit; it is not the amount borrowed or owed.

2026 budgets

These are plans, not final spending. The same $30 million appears once as money leaving MD 4 and MD 6 and once as money entering MD 1. It is still one $30 million transfer.

See the five combined 2026 budget figures
Cross-district budget calculations
FigureAmountTypeProvenance
Gross budgeted inflows$75.5M2026 budget
How calculated

Record comparison completed. Sum of every fund-level Total Revenues line in the seven final budgets: $75,453,034. Source pages: MD 1 pp. 1-3; MD 2 pp. 1-2; MD 3 pp. 1-3; MD 4 pp. 1-3; MD 5 p. 1; MD 6 pp. 1-3; MD 7 p. 1. Retrieved August 15, 2026. Version: provenance-2026.10.18.2.

Gross budgeted outflows$77.6M2026 budget
How calculated

Record comparison completed. Sum of every fund-level Total Expenditures line in the seven final budgets: $77,637,677. Source pages: MD 1 pp. 1-3; MD 2 pp. 1-2; MD 3 pp. 1-3; MD 4 pp. 1-3; MD 5 p. 1; MD 6 pp. 1-3; MD 7 p. 1. Retrieved August 15, 2026. Version: provenance-2026.10.18.2.

Budgeted 2026 property-tax revenue$8.7M2026 budget
How calculated

Record comparison completed. Combined property-tax schedule: $1,464,665 general operating + $7,254,754 capital/debt = $8,719,419. The schedule appears on MD 2 p. 3, MD 3 p. 4, MD 4 p. 4, and MD 7 p. 2. Retrieved August 15, 2026. Version: provenance-2026.10.18.2.

Assessed valuation subject to levy$117.2M2026 budget
How calculated

Record comparison completed. The combined property-tax schedule lists district assessed values totaling $117,202,830. It appears on MD 2 p. 3, MD 3 p. 4, MD 4 p. 4, and MD 7 p. 2. Retrieved August 15, 2026. Version: provenance-2026.10.18.2.

Budgeted capital transfer$30.0M2026 budget
How calculated

Record comparison completed. MD 4 and MD 6 each budget a $15M capital transfer to MD 1; MD 1 records $30M coming in. Because the same transfer is counted as money going out and money coming in, it contributes $60M to the gross totals. The transfer itself remains $30M. Source: MD 1 p. 2, MD 4 p. 2, and MD 6 p. 2. Retrieved August 15, 2026. Version: provenance-2026.10.18.2.

Compare past results with 2026 plans

Compare money in, spending, and plans for all seven districts

Wide table: scroll sideways to see every column. Open the source records for the original layout.

2024 actual revenue and expenditure alongside 2026 planned expenditure
District2024 actual revenue2024 actual expenditure2026 planned expenditureSource periods

District roster filings

Board service across the seven districts

The reviewed records list board offices and term years. This site replaces names with letter labels. Use the original notices to identify people and check the dates of their service.

Full masked roster, offices, and listed term years

Wide table: scroll sideways to see every column. Open the source records for the original layout.

Offices and term years shown in the reviewed district roster
District filing groupMasked roster entryOfficeListed term year
Compare repeated listings across district rosters
Board Member Alisted on 5 of 7 district rosters
Board Member Blisted on 4 of 7 district rosters
Board Member Clisted on 4 of 7 district rosters

Wide table: scroll sideways to see every column. Open the source records for the original layout.

Masked roster entries listed in multiple district filings
Masked roster entryMD 1MD 2MD 3MD 4MD 5MD 6MD 7Roster listings

Reading the comparison

A mark means the label appears in that district’s reviewed roster. A dash means it was not listed in those records. Counts describe the listings only; they do not establish attendance, votes, or matching service dates. Check original filings before identifying or describing a person’s roles.

Sources

District transparency notices and board roster webpage · View notices · View roster

Roster webpage retrieved August 15, 2026. Effective date: not stated by source.

Using these records

Take a specific question to the source

Use the district number, figure, reporting period, and linked record when contacting the district or attending a public meeting.

Plain-language definitions

Financial terms used on this page

Mill levy
A tax rate applied to assessed property value. One mill equals $1 per $1,000 of assessed value.
Assessed value
The taxable value used to calculate property tax. It is not the same as market value.
Principal
The borrowed amount that remains to be repaid.
Accrued interest
Interest recorded but not yet paid.
Subordinate bond
Debt paid after higher-priority obligations from revenue available under its terms.
Developer advance
Money advanced for district costs and reported as payable under terms shown in district records.
Interdistrict transfer
Money moved from one district to another for shared costs or capital work.
Debt service
Money used to pay borrowing costs, including interest and principal.
Pledged revenue
Revenue the district has committed to certain payments when available.
Audited actual
An amount reported for a completed fiscal year in audited financial statements.
Adopted budget
The district’s official revenue and spending plan for a budget year.
Illustrative scenario
A calculation based on stated assumptions. It is not a forecast or reported balance.

Documentation

Sources, calculations, and limits

Reported values remain separate from DataSplinter totals, comparisons, and illustrative scenarios.

Method

Each headline figure links to its source page, exact values, and formula.

Known limits

The future-balance example assumes no payment after 2024. Grouped obligation rows use mixed accounting bases. MD 5’s certified levy differs from its budget narrative, and the board webpage does not state a roster effective date.

Scope

This project reports what the linked records show. It does not infer motives, judge conduct, or score financial risk.

Linked source records

PDF source links open in a new tab. Page numbers count from the first page of the PDF, which may differ from printed page numbers. If your viewer does not jump to the page, enter the listed number. Linked webpages can change after retrieval; the dates here describe the records used for this review.

Board labels are permanently masked on this page and in its public data. DataSplinter is independent of the districts. Original records remain the authority. This is a reading aid, not an audit, a tax quote, or professional advice.

2025 annual figures added October 18, 2026. Historical records were reviewed through July 6, 2026, with source copies compared August 15, 2026. Calculations last updated August 15, 2026 for the 2024 detail; those historical figures remain unchanged. Later filings, corrected records, or source-site changes may update figures, links, or summaries. Page data version: October 18, 2026 · provenance-2026.10.18.2.

For sharing and further research

Use the figures with their context

Download 2025 annual figures and sources (CSV)

Keep the district, year, source page, and any limits with each figure you quote. A district summary does not establish the tax bill for a particular home.

CSV files open in spreadsheet software. The ledger lists each finding, formula, source, and review status. Checksums identify the source copies used; they do not verify the contents.

Annual records: years ended December 31, 2024 and December 31, 2025. Budgets and levies: 2026. The 2025 summary and comparisons were added October 18, 2026; historical calculations retain their original dates. Download 2025 results separately from the historical district and expense tables.

Suggested citation

DataSplinter, Lorson Ranch Metropolitan Districts 1-7, [district and figure], [record year], [original document and page], accessed [date]. Use “Link to this figure” beside a finding, then copy that address. State any difference between the source records.

Figures are summaries of public records, not legal, financial, or investment advice. Report a possible error.

Back to reading controls
Sources and sharing